Introduction
Last season, Premier League home advantage dropped to its lowest point since the league began (COVID season aside) Home advantage is one of sport’s most studied effects: on average, hosts win more than visitors. The size of that bump shifts by sport, league and country.
Why does it exist? In football, the usual suspects show up, home teams know the ground and routines, while away sides face an intense crowd, referees may lean subtly toward the hosts and travel takes a toll. One study even points to physiology – home players showing higher testosterone levels.
Home edge matters culturally and analytically. “Home form” is a managerial mantra, away days fuel underdog lore, and every serious xG-based prediction model bakes a home boost into its priors. Which makes last season’s dip noteworthy. Was it a blip or the start of a structural shift we’ll need to account for in forecasting? Let’s dive in.

The 2024-2025 Home Advantage Collapse
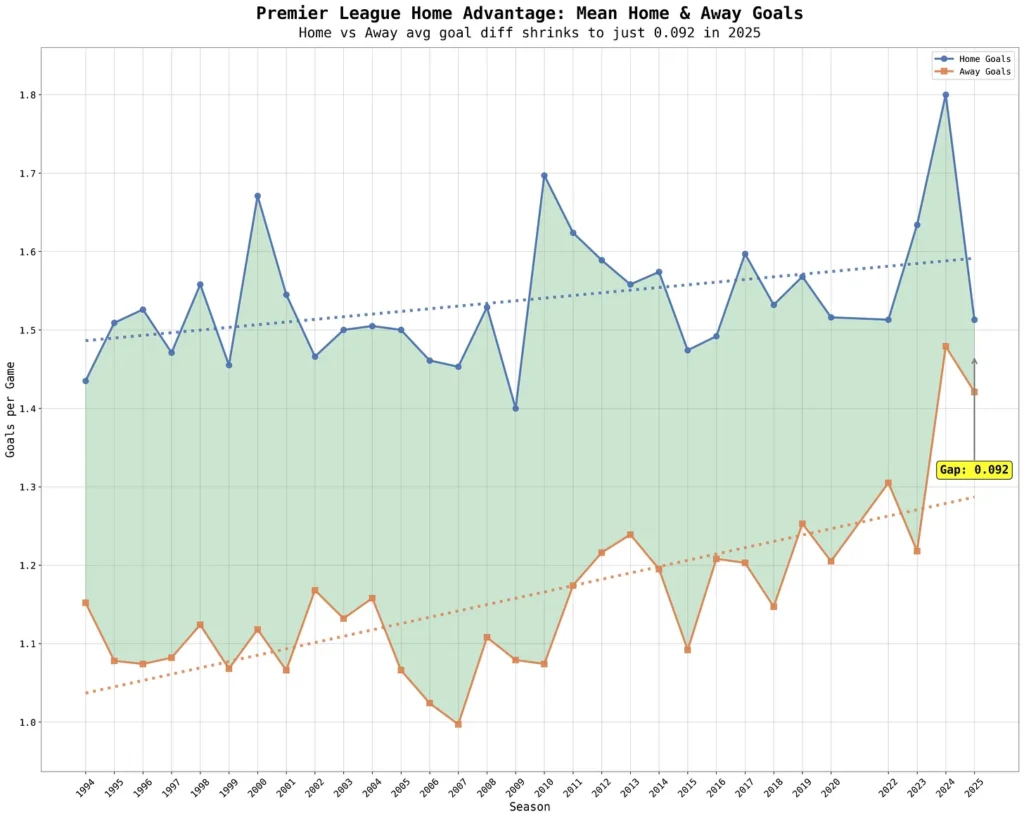
Historically, home teams in the Premier League have outscored visitors by an average of +0.37 goals per match. Last season that cushion shrank to just +0.09 – the lowest on record. We’ve excluded 2020/21 from this analysis, since empty stadiums make it a poor benchmark – for reference, home goal difference that year was +0.01.
The shift is even clearer when you plot home goal difference by season. The box plot compresses toward zero, highlighting how much the traditional home edge has thinned.
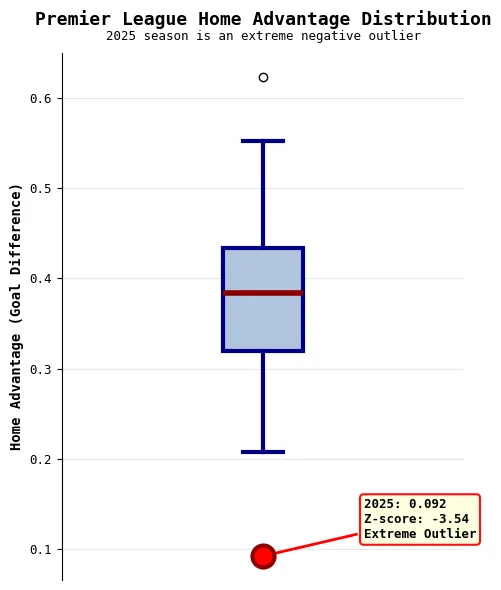
Last season wasn’t just low, it was an extreme outlier. The home goal difference came in 3.54 standard deviations below the historical mean, the kind of gap that hints at a structural shift rather than random noise. For context, the only other clear outlier was 2009/10, when home teams posted +0.62, but that deviation was far milder.
So what’s driving it? Trend lines point to a simple story. Away sides are scoring more as the years tick by. Home sides are up too, but at a slower pace. The result is a steadily narrowing home-away gap culminating in last year’s record-thin margin.
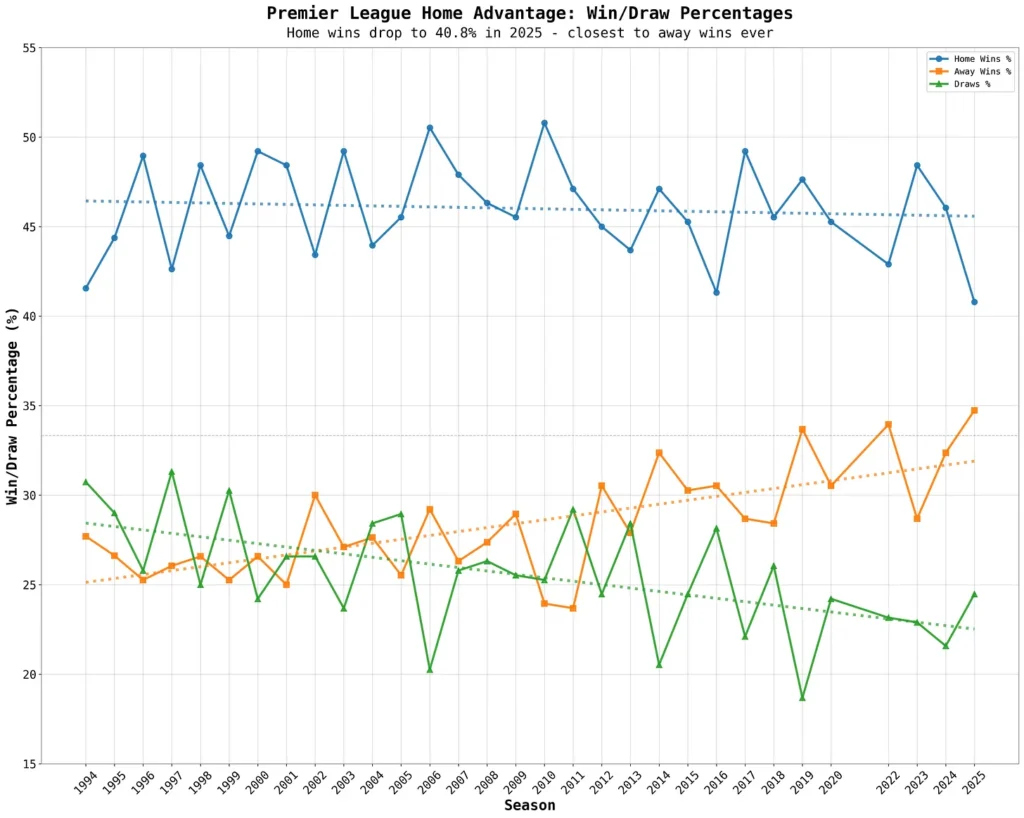
Looking at results tells the same story. Home win rate has been broadly flat with a gentle drift down, draws have fallen more sharply. Meanwhile, away wins have trended up and hit a high last season, brushing 35%. The gap between home and away victories in 2024/25 was the tightest the Premier League has ever seen.
The clearest driver of the swing looks to have improved away performance. Why that’s happening isn’t one thing, but a few forces line up. Money is flatter across the league, letting smaller clubs travel with a plan to play not just survive. Away sides press higher and attack more. Tactically, the influx of elite coaches has raised the floor and reduced risk aversion. Teams now rehearse the away environment itself – Mikel Arteta once played crowd noise in training to mimic Anfield. This didn’t seem to help as Arsenal lost their match 4-0 but illustrates how modern coaches take the home advantage into consideration.
Sign Up For Our Mailing List
Which Teams Drove the Changes?
Team by team, the picture gets even more interesting. A few sides still squeezed plenty from home comforts, while others were oddly better away from home.
In the chart below, we plot each club’s difference in goals scored and conceded at home. Note the flipped “Goals Against” axis. Positive performance in both categories lies in the top half of the chart.
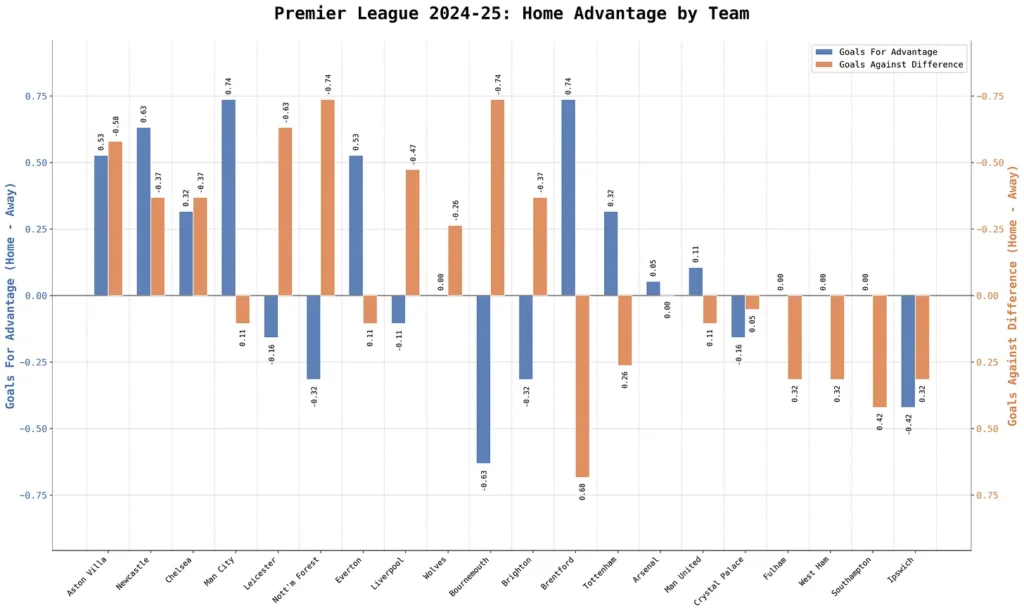
A few clubs still squeezed a real edge from home turf. Aston Villa, Newcastle and Chelsea improve both their scoring and their defending at home. That tracks with Villa Park and St James’ Park being notoriously hostile. Stamford Bridge less so, but Chelsea clearly found an extra gear there.
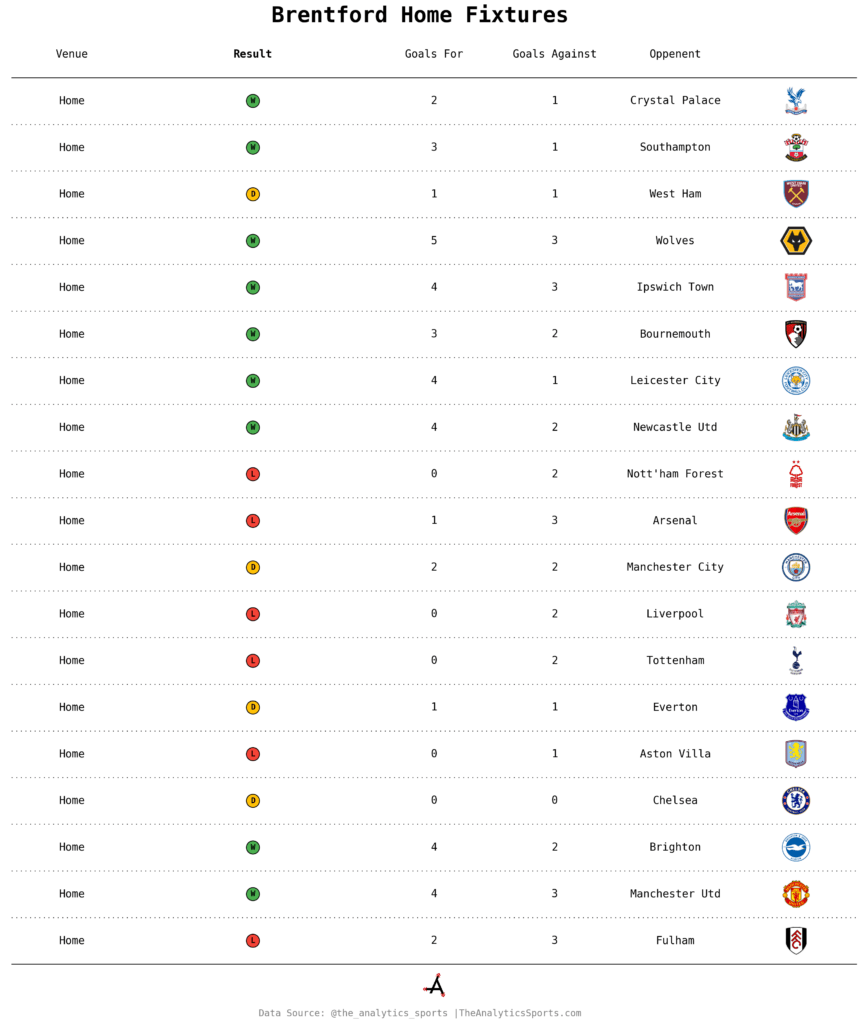
Brentford and Manchester City led the league for home bumps in goals scored, netting +0.74 more at home than away. For Brentford, a blistering first-half home run likely did a lot of lifting.
Brentford and Bournemouth also showed the sharpest swing between home and away in both goals scored and conceded. Brentford’s home games were particularly wild. They struck far more but leaked plenty too just scan the goals against columns in their home wins, in the table below
Bournemouth flipped the script. They scored 0.63 fewer goals at the Vitality, yet tightened up on their travels conceding 0.74 fewer away.
Four clubs showed no home bump at all. Fulham, West Ham, Southampton, and Ipswich. Portman Road felt lively whenever Ipswich played, but the numbers hint their underdog game plan may have clicked more cleanly on the road.
Conclusion
What does 2025/26 look like? Hard to call. Last season strayed so far from the baseline that it’s tough to know whether we caught a random swing or the start of something structural. The broader trend suggests the home edge is fading as away sides score more. A repeat of last year’s extreme dip feels unlikely, expect some reversion, even if the long-run slope points toward a slimmer home advantage.
Sign Up For Our Mailing List
Disclaimer: Data analysis isn’t about capturing every detail—it’s about uncovering meaningful patterns from what’s available. The data used in this study is both robust and thoughtfully selected, offering a reliable foundation for insight. While no dataset is ever truly exhaustive, we aim to be honest and provide insightful interpretation.