Introduction
T20 cricket is often described as the closest the sport comes to resembling football. It’s a popular comparison, but many of the deeper parallels tend to be overlooked. One such parallel is at the heart of today’s discussion. In football, the goal-scorer usually takes the spotlight, while the assist – the pass that created the chance – rarely gets the recognition it deserves. A similar dynamic plays out in T20 cricket, where commentators frequently note that
“X bowler probably deserves more credit for that wicket than Y who actually took it!”
These situations usually arise when one bowler builds sustained pressure, only for the next bowler to step in and claim the reward. It’s a subtle but vital aspect of the game and one that’s becoming increasingly common in the modern T20 era, with scoring rates higher than ever, it now takes a greater shift in the required run rate (RRR) to create genuine wicket-taking opportunities. The RRR is the average number of runs a batting team must score per over to reach their target in the remaining overs. For example, if a team needs 60 runs from 6 overs, the required run rate is 10 runs per over.
But can we actually measure it? Can we put a number on how much a previous bowler contributed to creating a wicket? To answer that, we introduce a new metric: The Wicket Assist Percentage.
The Methodology
For this analysis, we look only at second-innings scenarios and focus on how an good over can set up a wicket. An good over is simply an over where the bowler gives away very few runs compared to what the batting team needs or usually scores. In T20, for example, if the batting side needs 10 runs per over but the blower only concedes 4 or 5, that is considered an good over because it puts pressure on the batters.
To do this, we classify the over before a wicket into two types:
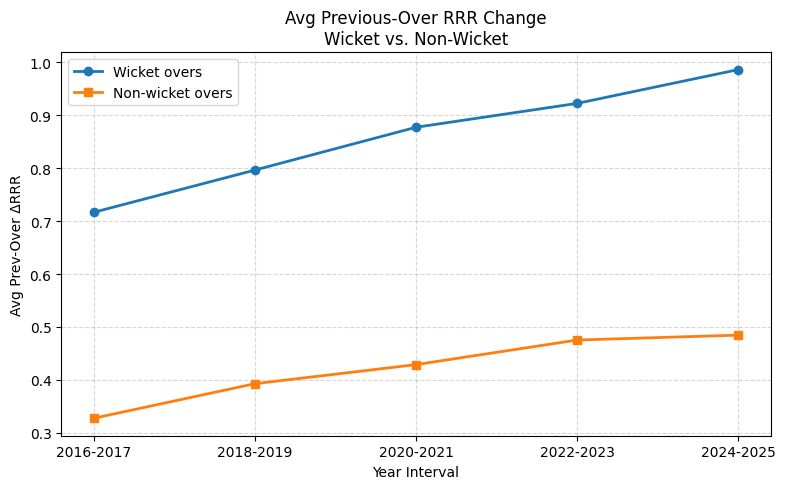
- Good Over: when the RRR goes up by the end of the over.
- Bad Over: when the RRR stays the same or goes down.
- Change in the RRR in the previous over
- The current over number
The output from our model is the wicket probability in the current over. By comparing the actual chance of a wicket with the usual baseline for that stage of the game. We can work out how much credit the previous bowler deserves, their wicket assist percentage in setting up that dismissal.
The base wicket probability in the current over is calculated using only the current over number, the change in RRR is zero. The actual wicket probability is calculated using the current over number and the change in RRR from the previous over.
Given, the base and actual wicket probability. We obtain the previous bowler contribution to a wicket using the formula below:
- (Actual – Base) / Actual
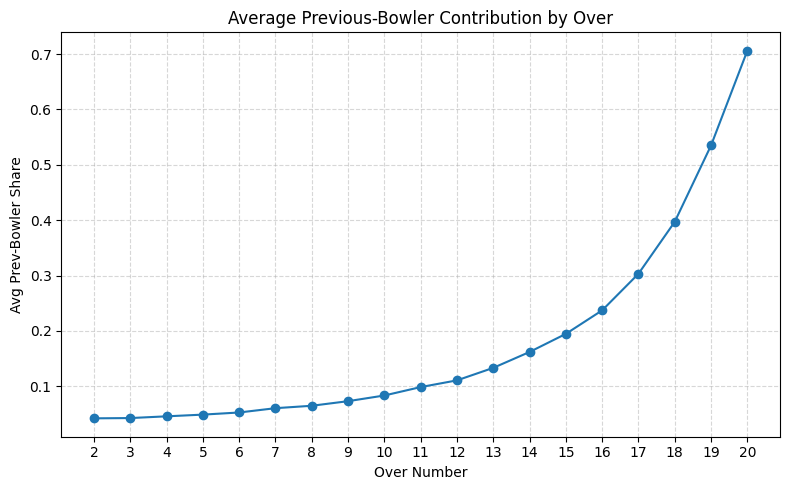
This graph above shows, in later overs, the previous bowler contributes much more to a wicket than in earlier overs.
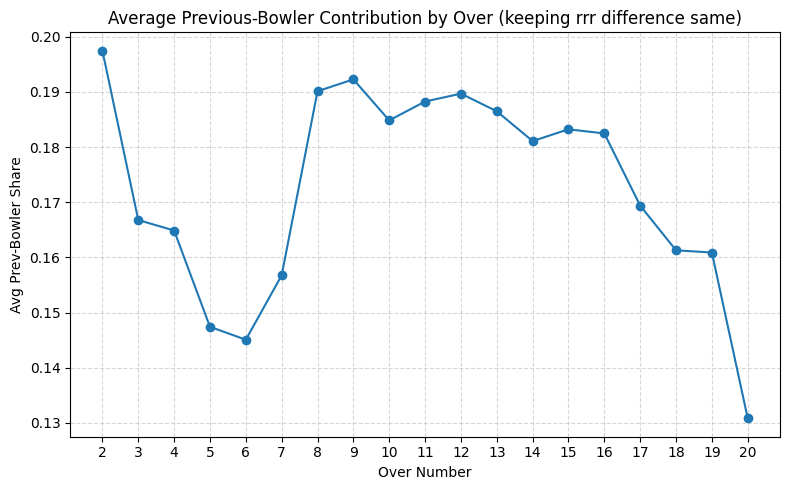
The graph above shows the average contribution from a bowler in the previous over for a fixed change in RRR. The first over, the blower contributes the most, then we see a huge drop off in contributions, the picks back up between the 7th and 15th over and finally the last over has the least contribution.
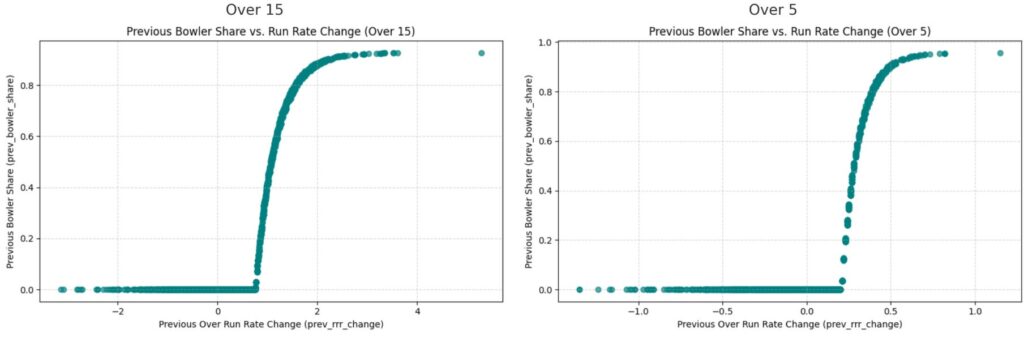
A quick look at both graphs show that in later overs a greater change in RRR is required for the previous bowler to attain the same wicket assist percentage as in earlier overs.
Sign Up For Our Mailing List
The Best Assistors
We define a wicket as being “created” by a bowler when it falls in the very next over after they’ve delivered a good over. In that case, the bowler is credited with an assist. The Wicket Percentage Assist metric captures how much that good over contributed to the wicket. As discussed above, the most meaningful way to interpret this measure is by comparing it phase by phase.
Death Overs - Over 16 to 20
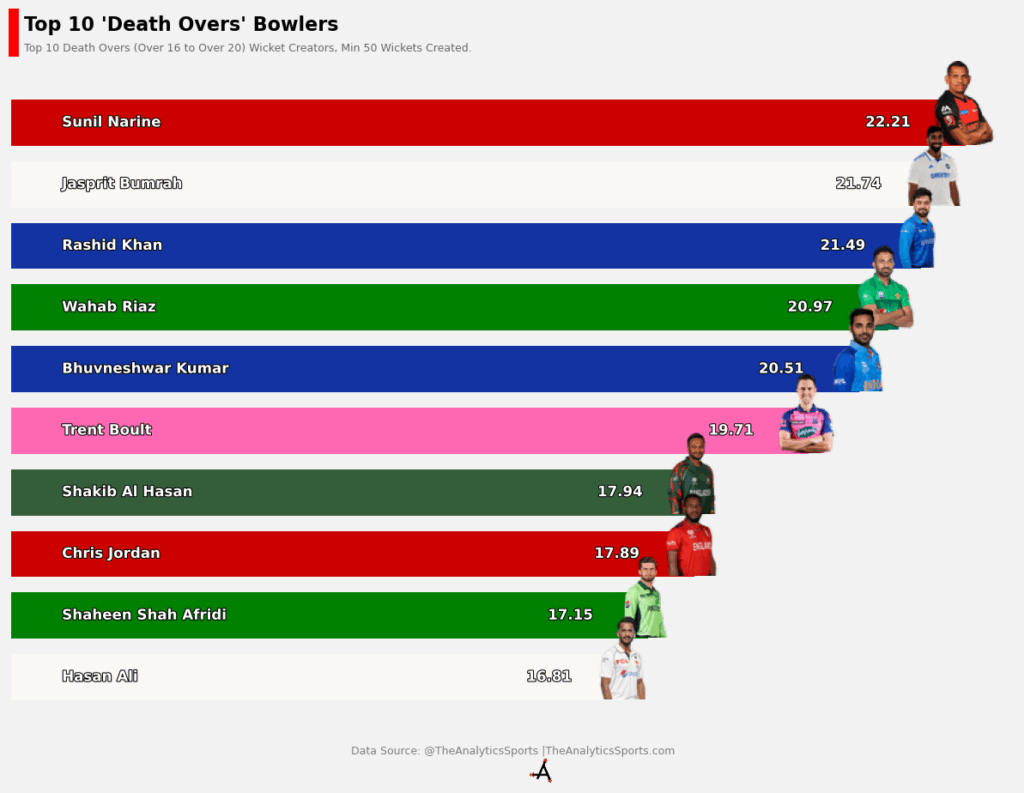
Sunil Narine and Rashid Khan are the standout names here, leading the way alongside Jasprit Bumrah in what is otherwise a pacer-dominated phase. One factor working in favour of the spinners on this list is that they usually operate in the first half of this five-over stretch, where conditions often tilt slightly their way.
For the IPL faithful, here’s a more league focused breakdown
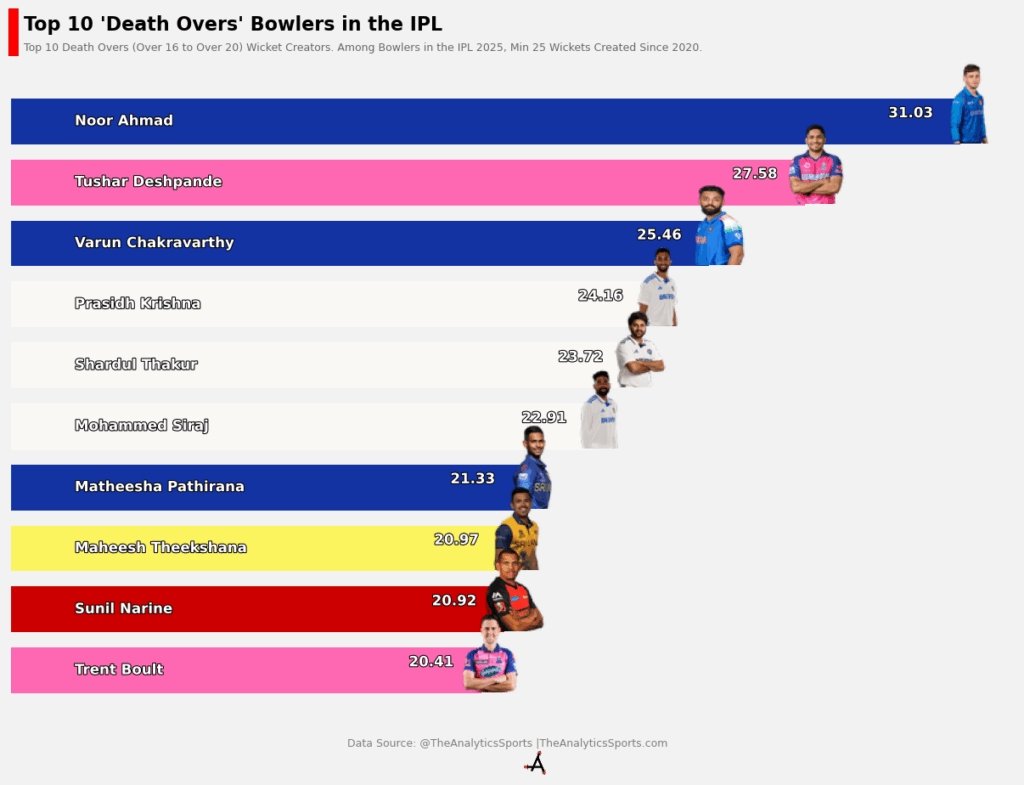
Noor Ahmad’s presence on this list comes as no surprise. Across leagues around the world, he has consistently been trusted with difficult overs and has delivered more often than not. On the other hand, Jasprit Bumrah’s situation has been quite different. Since 2020, he hasn’t had much quality support around him. To put this into perspective, between 2016 and 2020, 20.48% of his wickets were assisted by the pressure created from other bowlers, since 2020, however, that figure has dropped to just 15.70%. It’s a telling statistic and one that perhaps explains a lot about Mumbai Indians’ bowling struggles in the 2020s.
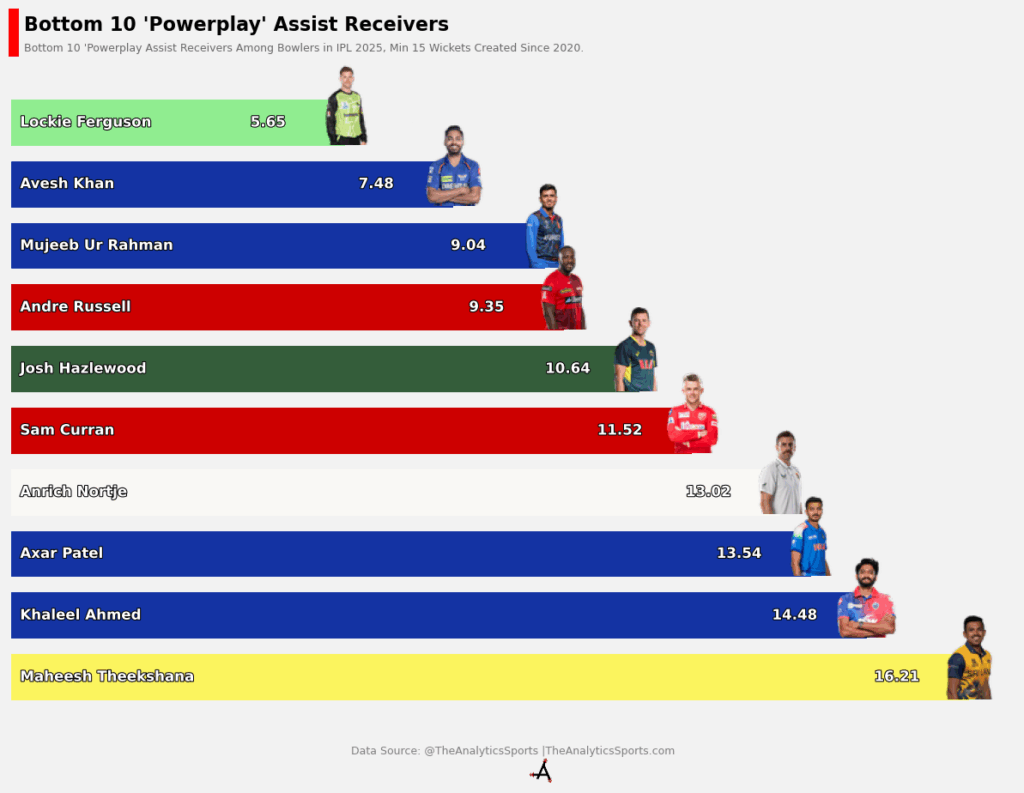
Powerplay - Over 1 to 6
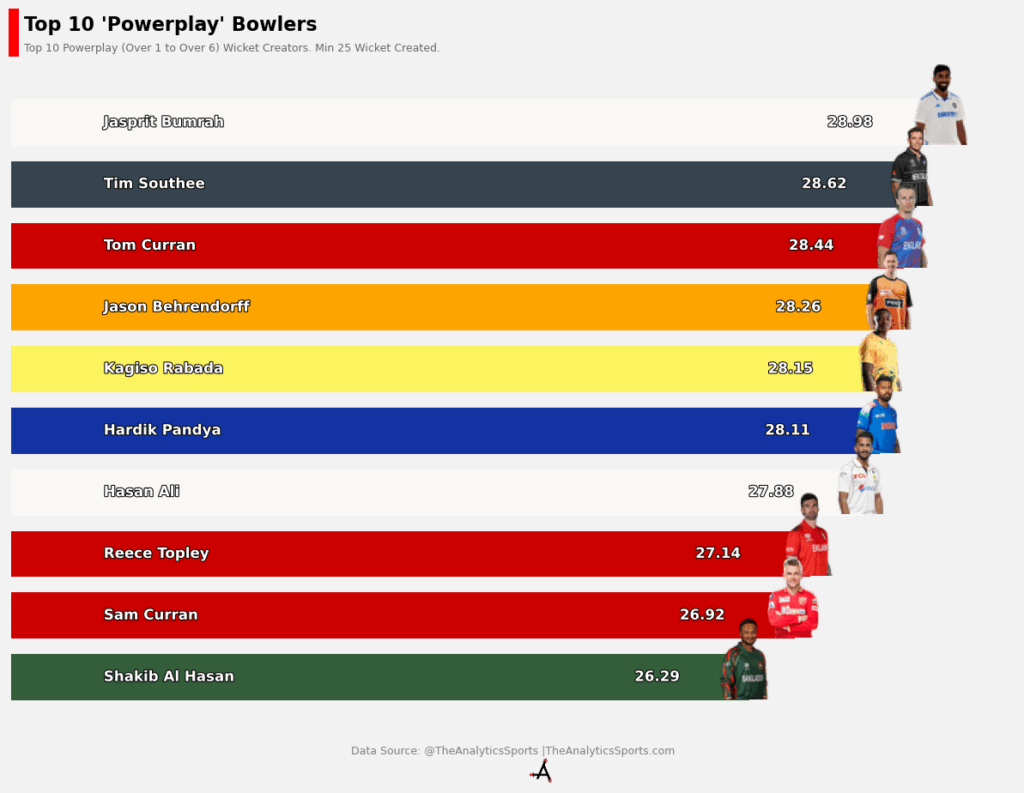
Over the past decade, Jasprit Bumrah has topped the global charts, underlining his dominance with the new ball. Hardik Pandya has also emerged as an effective option, particularly in recent sessions where he has increased his share of powerplay overs. Together, they highlight the impact of Indian bowlers in the early phrases of the game. With that context, here’s a closer look at the IPL-specific list:
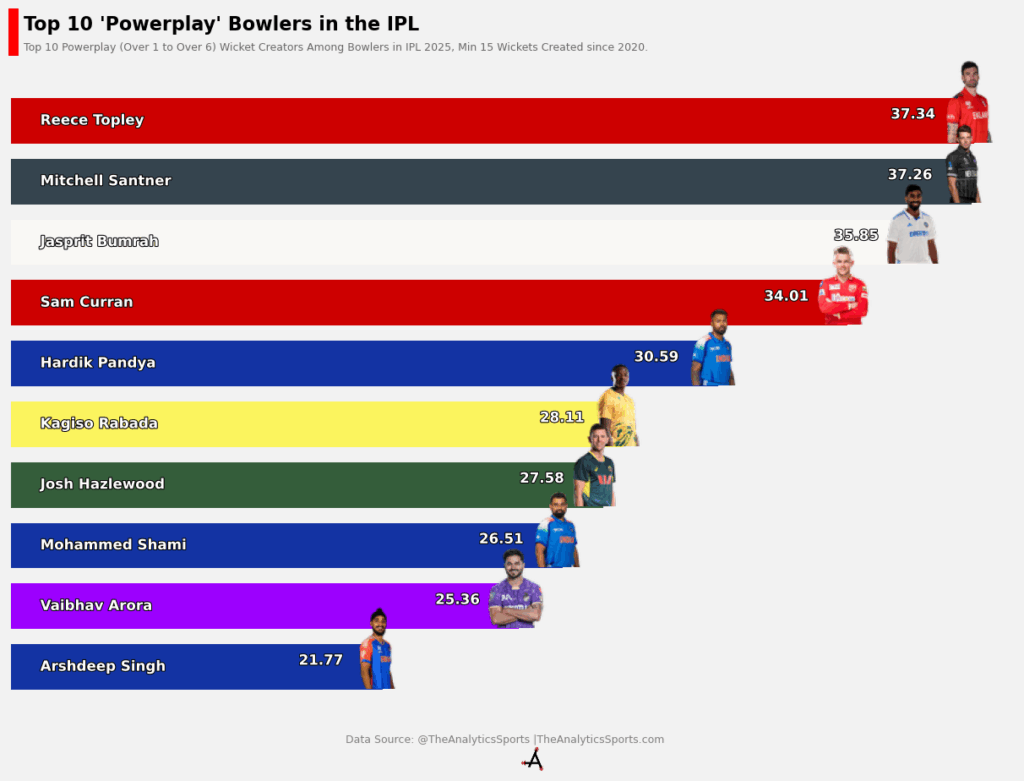
This is clearly a metric that rewards defensive bowlers, and Mitchell Santner stands out with an outstanding 37.26% contribution to wickets taken by his teammates in the powerplay. Another interesting observation comes from Josh Hazlewood and Sam Curran. Both feature in the top 10 for providing the highest assist, while also ranking among the lowest in receiving them. This suggests that their respective bowling attacks have leaned heavily on their ability to create pressure and breakthroughs.
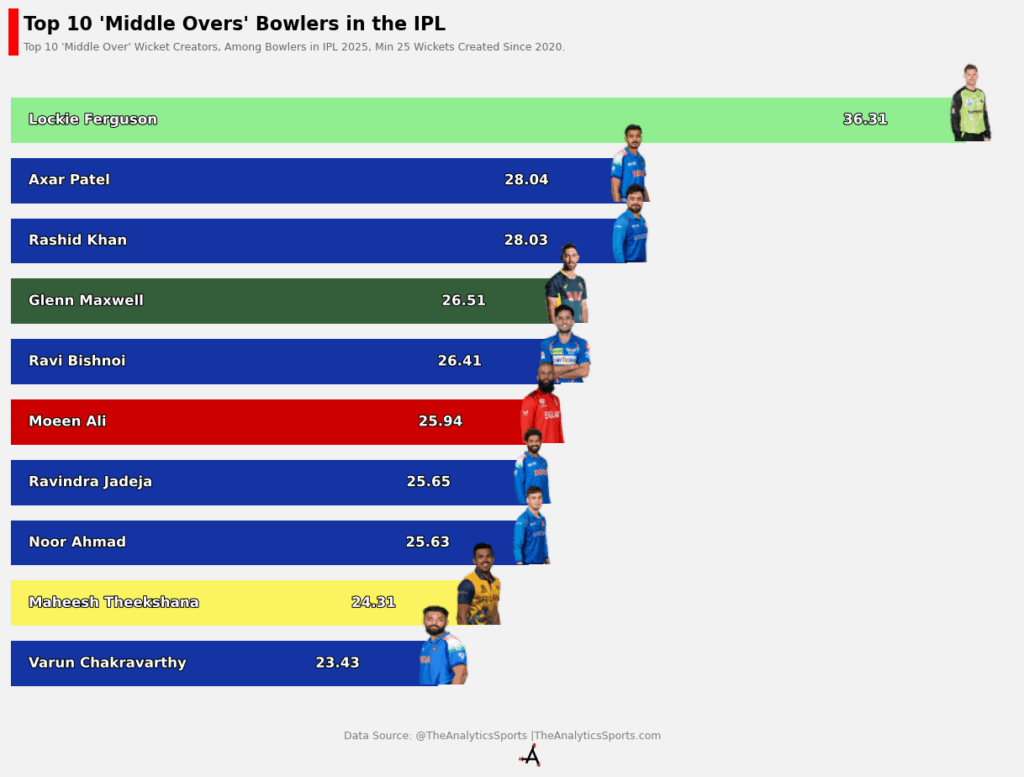
Middle - Over 7 to 15
We grouped the remaining nine overs as the middle. As expected, the middle overs are dominated by spin. One standout performer, Lockie Ferguson, who has topped the charts among IPL bowlers since 2020. Glenn Maxwell, often recognised for his batting, makes an appearance with an impressive T20 economy rate of just 7.63 since 2020.
Sign Up For Our Mailing List
Disclaimer: Data analysis isn’t about capturing every detail—it’s about uncovering meaningful patterns from what’s available. The data used in this study is both robust and thoughtfully selected, offering a reliable foundation for insight. While no dataset is ever truly exhaustive, we aim to be honest and provide insightful interpretation.