Introduction
Last summer, a Double Pivot podcast episode posed a great thought experiment. “If both sides post a +1.0 expected goal difference, would you rather be an unstoppable attacking team (2.5 xG / 1.5 xGA) or immovable defensive team (1.5 xG / 0.5 xGA team) ?
This question feels particularly relevant given the ongoing tactical discourse in the Premier League. Mikel Arteta’s Arsenal exemplifies the defensive approach, regularly limiting opponents to under 0.5 xG per game, which is very impressive, yet Arteta is often criticised for being too conservative compared to the more expansive styles of Pep and Slot. The podcast’s conclusion that you’d rather be the great defensive team (1.5 xG / 0.5 xGA) suggests these critics are potentially being overly harsh or trying to force a narrative, looking at you Gary Neville.

You can hear their debate in the episode using this link. It nudged us towards an old cliche with fresh legs. Maybe “defence wins titles” has more truth than we would admit. This piece digs into that idea with simulations to put numbers behind the hunch.
To be clear, the toy teams here are deliberately extreme. No side has sustained 0.5 xGA per 90 over a full season in the xG era – Mourinho’s first Chelsea team, who conceded just 15 goals, is the closest historical. The nearest real analogue is Man City 2017/18 at 0.63 xGA per 90 – and they were even better overall at 1.44 xGD per 90. On the flip side, 2.5 xG per 90 for a season is basically mythical, City 2019/20 team peaked around 2.42 xG per 90 and they didn’t lift the title.
So while +1.00 xGD per 90 is very doable, plenty of teams have exceeded this value. The exact attack and defence split in these examples push beyond what we see in reality. That’s fine, as we can think of them as exaggerated profiles to stress-test the questions rather than targets any manager could actually hit.
Experiment Design
To test this idea, we simulated 38-games seasons for each profile. For every match, we drew the team’s xG and xGA from gamma distributions, then treated those draws as the Poisson rates to generate actual goals for and against. From there, it’s straightforward to compare total points and goal difference. We repeat the whole process thousands of times.
One key choice is allowing the xG to fluctuate. A side that averages 2.10 xG won’t land on 2.10 every weekend, there’s a real match-to-match variance worth modelling.
Premier League data backs this up. Last season’s team xG totals are well described by gamma distributions. In fact, if you plot xG and xGA for individual teams, the fitted gamma curves (in red) sit neatly over the histogram, capturing the shape of the empirical spread.
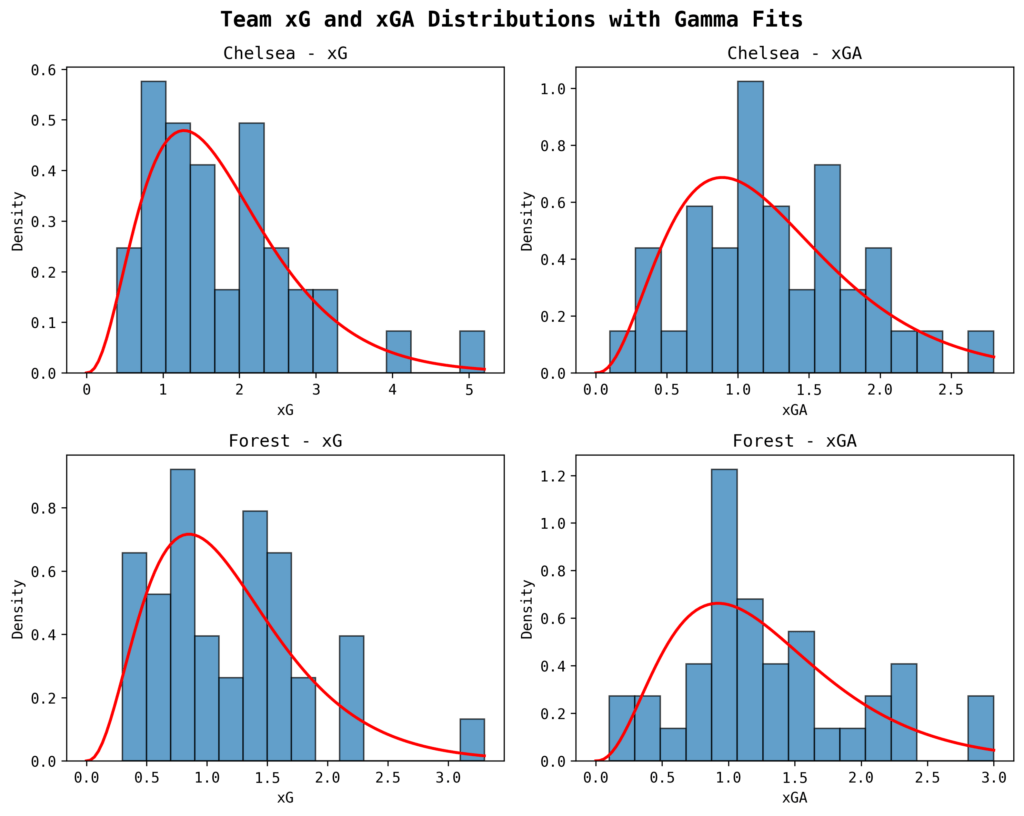
Gamma models need two parameters: a mean and a shape (controlled by the variance). Looking across last season, teams’ xG and xGA were well fit with an average shape near 3.5, so we used a value of 3.5 for this experiment.
With that shape known, we fixed gamma distributions for the two theoretical teams and drew 38 matches a piece. The simulated xG and xGA histogram look much like real world profiles – think Chelsea and Forest last year – which gives confidence that this setup mirrors how team chance creation and concession actually fluctuate over a season.
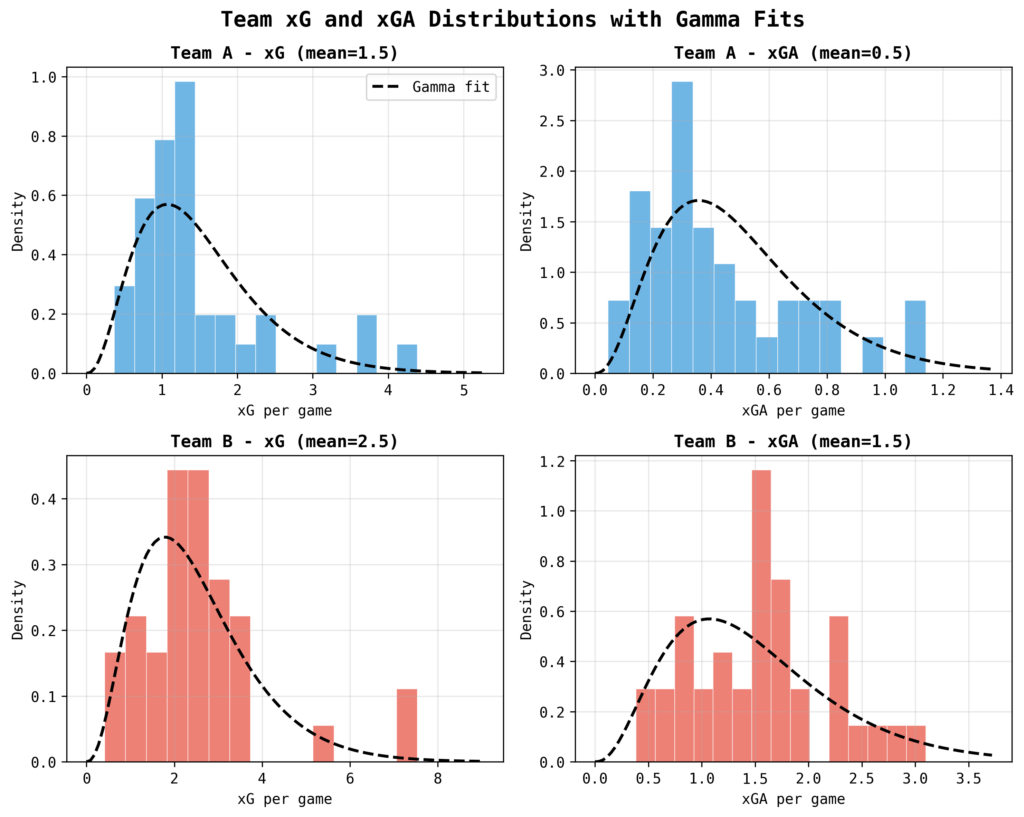
Those sampled xG numbers become the Poisson rates for each fixture i.e. we plug them in as the lambda value (mean) to simulate how many goals the team actually scores in that match.
Sign Up For Our Mailing List
Results
With those scorelines in hand, we can spin up full 38-game campaigns and then repeat the process thousands of times. The chart below plots the resulting points distributions for both teams across 10,000 simulated seasons, showing how often each profile lands on a given total.
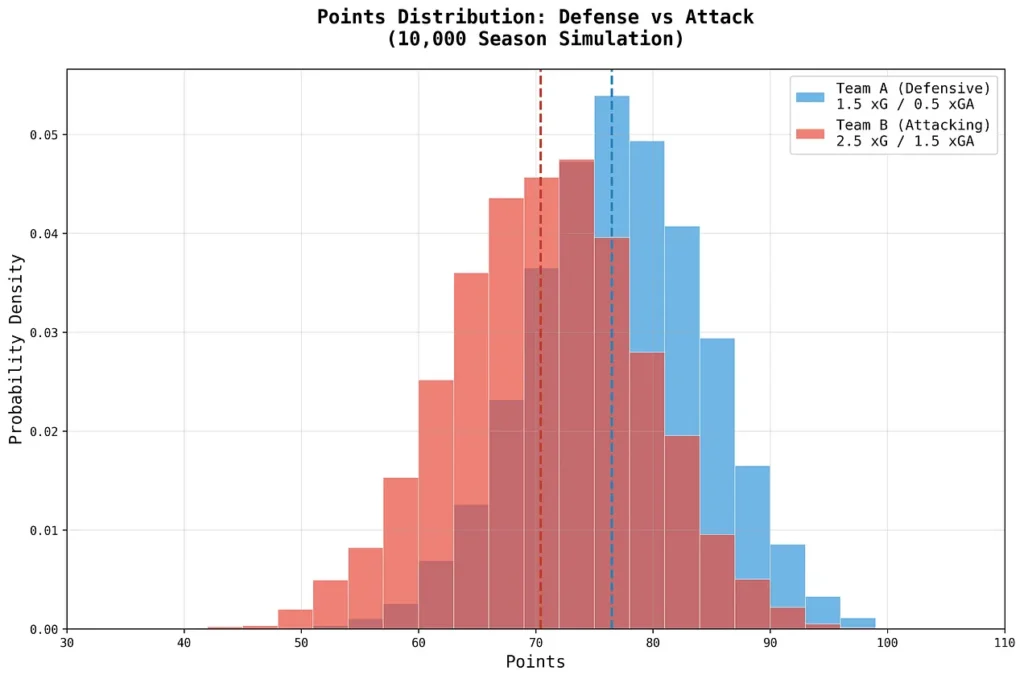
Team A – the great defence team (1.5 xG / 0.5 xGA) – comes out ahead, averaging 76.5 points versus 70.4 for Team B – great attack team (2.5 xG / 1.5 xGA ). We can also observe that the spread for Team A is tighter, hinting at more consistent week-to-week.
That lines up with The Double Pivot’s takeaway: If both sides have a +1.0 xGD, you’d rather be the elite defensive team. The stability you gain by suppressing chances against seems to beat the upside of piling on more attacking xG.
To push the idea further, we broadened the test to a wider set of +1.0 xGD teams, since 1.5/0.5 and 2.5/1.5 were just illustrative picks. The plot below charts average points for a range of theoretical +1.0 xGD profiles using the same simulation engine.
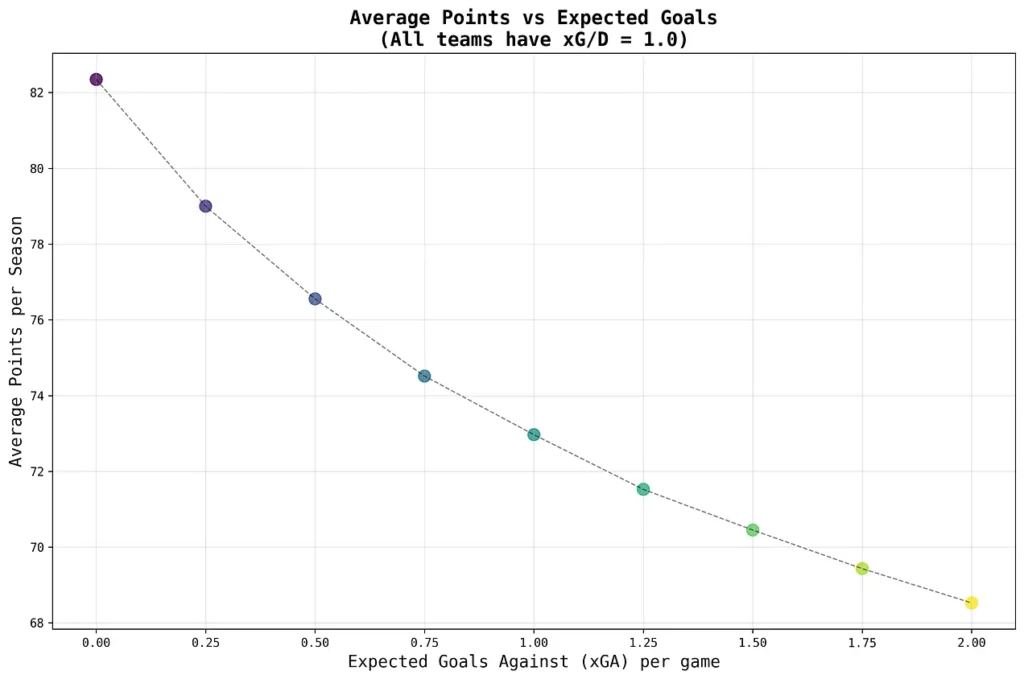
The takeaway is clear, as defensive strength improves, expected points rise. The curve flattens as you move right, underscoring that shaving xGA pays off more than simply adding xG, at least when overall xGD stays fixed. Context matters, though a +2.0 xGD side with 2.75 xG / 0.75 xGA will still outperform a +1.0 xGD team with 1.5 xG / 0.5 xGA.
One more sanity check, no one holds opponents to 0.00 xGA over a season. That edge is theoretical, not attainable.
Conclusion
So what’s the punchline? Arsenal should win the 2025/26 premier league crown. this articles shows trading some attacking volume for tighter shot suppression tends to produce better results. Modern discourse often celebrates teams that crank up chance creation but this experiment shows otherwise, we can say defence really does win championships.
Sign Up For Our Mailing List
Disclaimer: Data analysis isn’t about capturing every detail—it’s about uncovering meaningful patterns from what’s available. The data used in this study is both robust and thoughtfully selected, offering a reliable foundation for insight. While no dataset is ever truly exhaustive, we aim to be honest and provide insightful interpretation.